Evaluate Design Choices to Prioritize Product Backlog with Conjoint Survey
prioritization
product backlog
conjoint survey
new process
Problem
The property listing page is the most critical touchpoint for home buyers to evaluate prospective homes on Realtor.com. The internal team had explored many design directions and improvements for different modules, resulting in cluttered backlogs with unclear prioritization.
With limited resources, it is challenging to determine which of the many identified opportunities would provide the greatest return on investment, as determined by value to users. The team needs a way to focus efforts on the improvements that would have the biggest impact.
![]()
Problem
The property listing page is the most critical touchpoint for home buyers to evaluate prospective homes on Realtor.com. The internal team had explored many design directions and improvements for different modules, resulting in cluttered backlogs with unclear prioritization.
With limited resources, it is challenging to determine which of the many identified opportunities would provide the greatest return on investment, as determined by value to users. The team needs a way to focus efforts on the improvements that would have the biggest impact.
With limited resources, it is challenging to determine which of the many identified opportunities would provide the greatest return on investment, as determined by value to users. The team needs a way to focus efforts on the improvements that would have the biggest impact.

Research Questions
︎
What improvements would add the most value to the current user?
︎
How useful is each improvement compared to the others?
︎
What area(s) of improvements influence user preference the most?
Research Questions
︎
What improvements would add the most value to the current user?
What improvements would add the most value to the current user?
︎
How useful is each improvement compared to the others?
How useful is each improvement compared to the others?
︎
What area(s) of improvements influence user preference the most?
What area(s) of improvements influence user preference the most?
Methodology
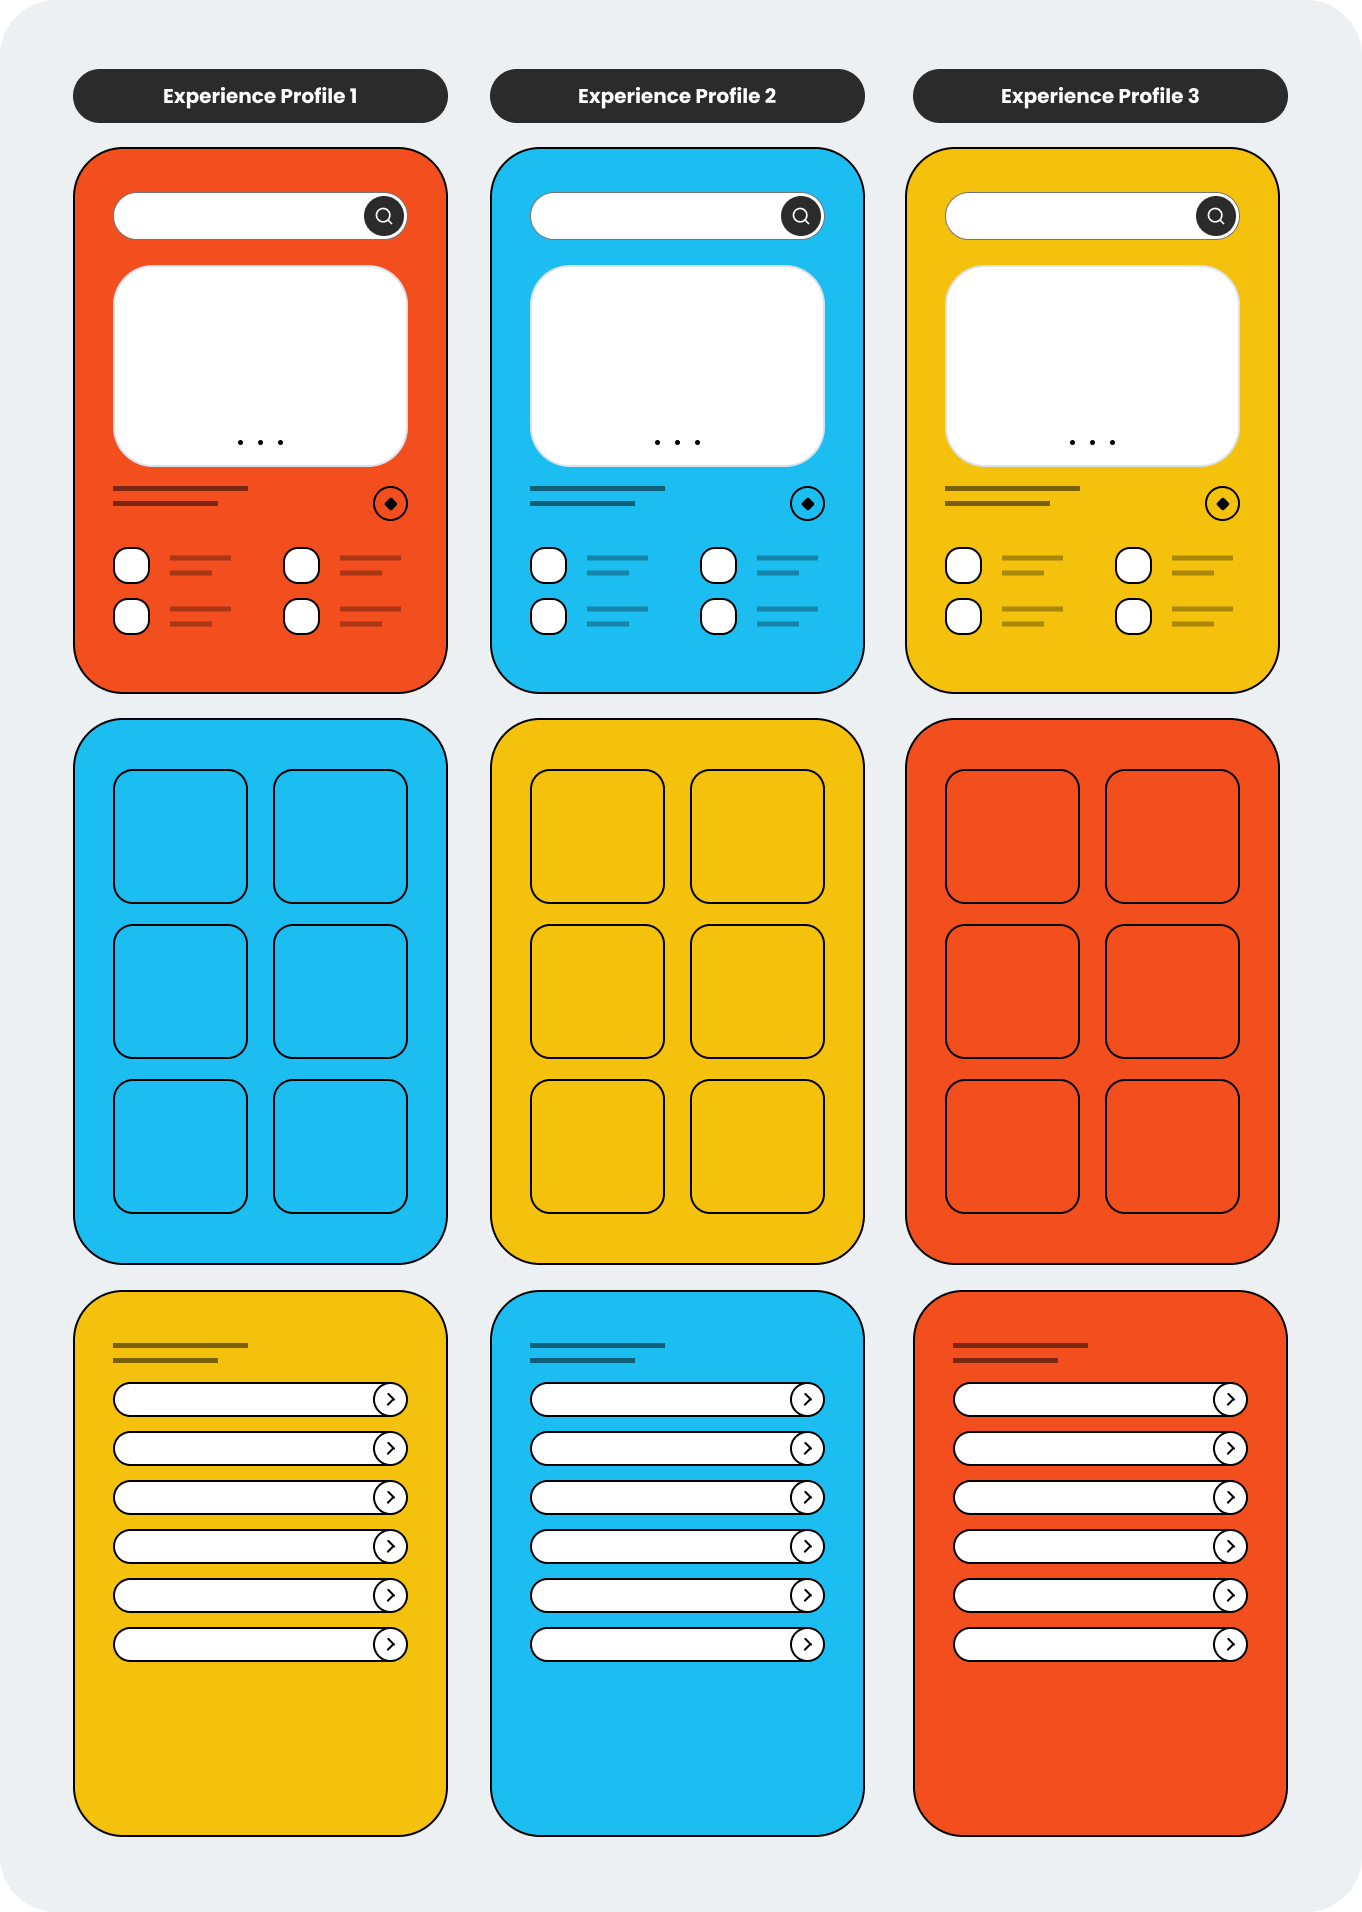
A choice-based conjoint analysis survey was administered to 400+ current users who searched for homes to purchase in the upcoming months. Respondents were presented with a series of randomized experience profiles featuring different variations of the property listing page. Respondents selected their preferred option from each profile set. The discrete choices revealed the relative importance of attributes and the impact of specific improvements.
For more information about this methodology, I outlined the use of conjoint analysis for user experience design here.
![]()
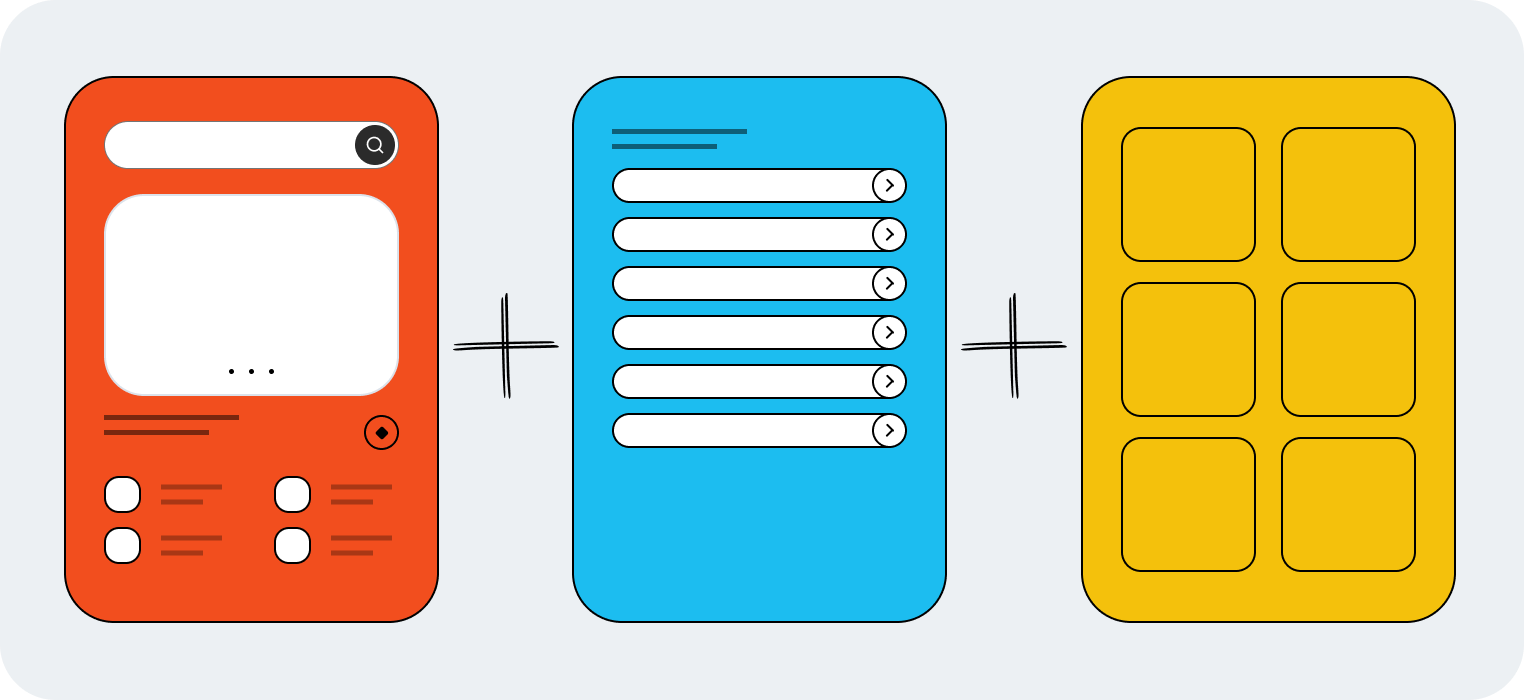
︎︎︎We deconstructed the experience into key components that are somewhat independent from one another. Each of these components—let’s call this “feature”—had multiple levels representing potential improvements and a control level. This lets us try out various combinations of these parts in a randomized survey environment.
Methodology
A choice-based conjoint analysis survey was administered to 400+ current users who searched for homes to purchase in the upcoming months. Respondents were presented with a series of randomized experience profiles featuring different variations of the property listing page. Respondents selected their preferred option from each profile set. The discrete choices revealed the relative importance of attributes and the impact of specific improvements.
For more information about this methodology, I outlined the use of conjoint analysis for user experience design here.
![]()
︎︎︎We deconstructed the experience into key components that are somewhat independent from one another. Each of these components—let’s call this “feature”—had multiple levels representing potential improvements and a control level. This lets us try out various combinations of these parts in a randomized survey environment.
For more information about this methodology, I outlined the use of conjoint analysis for user experience design here.

︎︎︎We deconstructed the experience into key components that are somewhat independent from one another. Each of these components—let’s call this “feature”—had multiple levels representing potential improvements and a control level. This lets us try out various combinations of these parts in a randomized survey environment.
What is
Conjoint Survey?
Conjoint Survey?
Think of the conjoint survey method like creating a "recipe" for a product that people would love. Imagine you're making a special dish and you have different ingredients to choose from.
Instead of asking people directly what they want, which can be confusing, you show them different versions of your dish with various ingredients mixed in. Then, you ask them to tell you which versions they like the most and which ones they like the least.
By doing this, you can figure out which ingredients (or features) are the most important to people and which combinations they prefer.
Adapting Product Profiles to Experience Profiles:
Conjoint analysis typically involves showing people randomized combinations of product attributes to capture preferences. This methodology can be applied to interface design by creating "experience profiles." These profiles consist of interface elements that are varied and combined randomly. Evaluating different permutations reveals how elements impact the overall user experience (as indicated by user preference). While conjoint analysis allows for controlled experimentation, care must be taken to keep the testing realistic and representative of real usage:
Conjoint analysis typically involves showing people randomized combinations of product attributes to capture preferences. This methodology can be applied to interface design by creating "experience profiles." These profiles consist of interface elements that are varied and combined randomly. Evaluating different permutations reveals how elements impact the overall user experience (as indicated by user preference). While conjoint analysis allows for controlled experimentation, care must be taken to keep the testing realistic and representative of real usage:
Advantages
︎ Broader Design Exploration:
Experience profiles enable testing of both safe and bold design directions in one setting (need to be comparable). Ideally for initial design phrase without fixating on usability concerns.
︎ Efficient Testing:
Randomized combinations in experience profiles reduce the need for numerous prototypes and tests, saving time and resources.
︎ Assess Holistic Preferences:
User preferences might not solely be driven by individual features but by the synergy of various elements in the overall experience. Experience profiles capture these interdependencies effectively.
Disadvantages
︎ Survey Length:
Testing multiple combinations of experience profiles can increase survey length, especially when visual stimuli is included.
︎ Lack of Context:
User experience is often more subjective and context-dependent than physical product attributes. Participants may make seemingly arbitrary choices based on visual appeal rather than true utility.
︎ Difficult to Pin Point Differences in Variations:
It can be more difficult to clearly convey levels of interface elements compared to physical products. Participants may struggle to grasp the implications of variations like dropdowns versus sliders, unlike more concrete attributes like phone size.
Survey Design
Several tactics were used to alleviate potential issues of using Conjoint survey for experience profiles:
Tactics
︎ Enhance context:
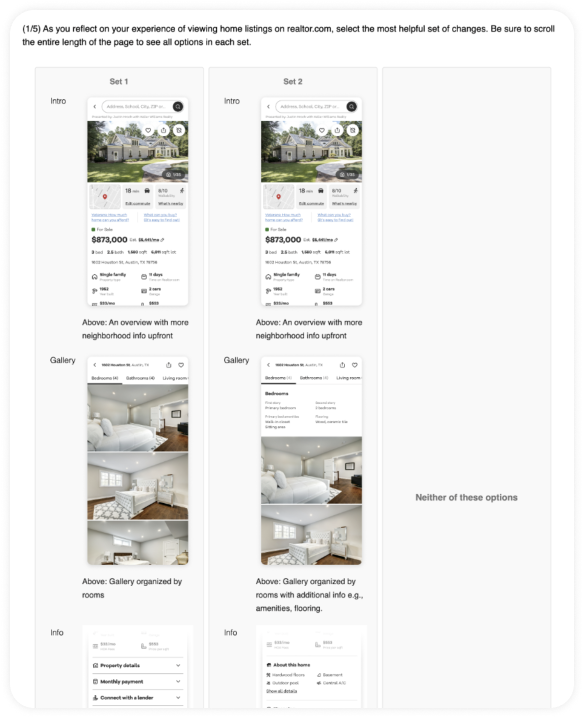
Participants were selected from an intercept survey displayed on the experience we wanted to survey. Images were shown in the order of the actual page layout to mimic the actual user experience. Usage scenarios and tasks to frame the ask were also provided i.e., provide feedback on the experience they were just using.
︎ Reduce Survey Complexity:
To reduce the overwhelming effect of presenting complex experience profiles with multiple visuals, only two profiles were presented at a time. Participants were also given options to select neither of the experience profiles presented.
︎ Pinpoint Variations
Include clear and concise descriptions to explain the differences of each variation.
![]()
Advantages
︎ Broader Design Exploration:
Experience profiles enable testing of both safe and bold design directions in one setting (need to be comparable). Ideally for initial design phrase without fixating on usability concerns.
︎ Efficient Testing:
Randomized combinations in experience profiles reduce the need for numerous prototypes and tests, saving time and resources.
︎ Assess Holistic Preferences:
User preferences might not solely be driven by individual features but by the synergy of various elements in the overall experience. Experience profiles capture these interdependencies effectively.
Disadvantages
︎ Survey Length:
Testing multiple combinations of experience profiles can increase survey length, especially when visual stimuli is included.
︎ Lack of Context:
User experience is often more subjective and context-dependent than physical product attributes. Participants may make seemingly arbitrary choices based on visual appeal rather than true utility.
︎ Difficult to Pin Point Differences in Variations:
It can be more difficult to clearly convey levels of interface elements compared to physical products. Participants may struggle to grasp the implications of variations like dropdowns versus sliders, unlike more concrete attributes like phone size.
Survey Design
Several tactics were used to alleviate potential issues of using Conjoint survey for experience profiles:
︎ Enhance context:
Participants were selected from an intercept survey displayed on the experience we wanted to survey. Images were shown in the order of the actual page layout to mimic the actual user experience. Usage scenarios and tasks to frame the ask were also provided i.e., provide feedback on the experience they were just using.
︎ Reduce Survey Complexity: To reduce the overwhelming effect of presenting complex experience profiles with multiple visuals, only two profiles were presented at a time. Participants were also given options to select neither of the experience profiles presented.
︎ Pinpoint Variations
Include clear and concise descriptions to explain the differences of each variation.
Tactics
︎ Enhance context:
Participants were selected from an intercept survey displayed on the experience we wanted to survey. Images were shown in the order of the actual page layout to mimic the actual user experience. Usage scenarios and tasks to frame the ask were also provided i.e., provide feedback on the experience they were just using.
︎ Reduce Survey Complexity: To reduce the overwhelming effect of presenting complex experience profiles with multiple visuals, only two profiles were presented at a time. Participants were also given options to select neither of the experience profiles presented.
︎ Pinpoint Variations
Include clear and concise descriptions to explain the differences of each variation.
Key Findings
︎
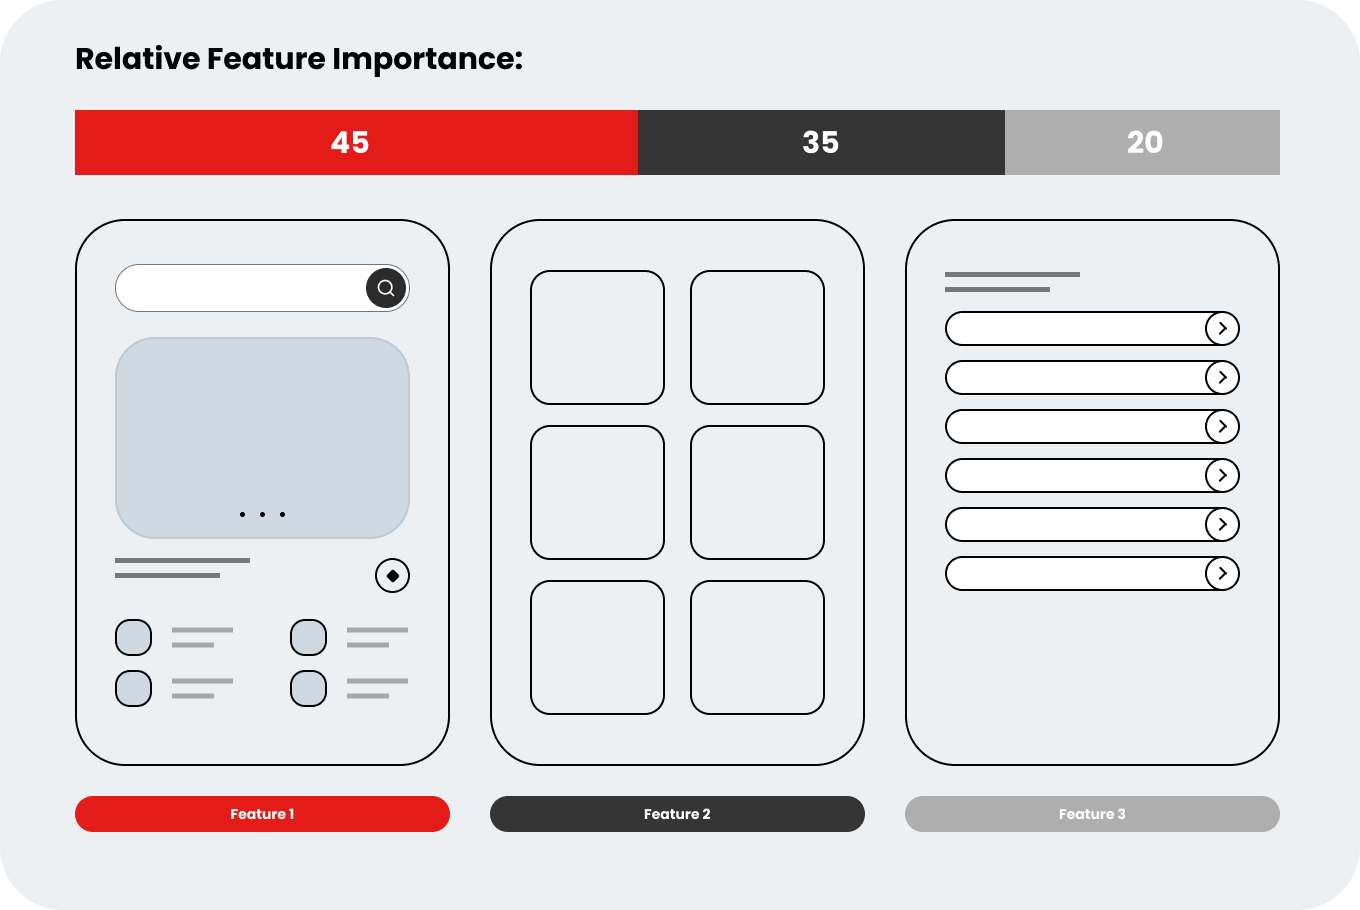
Relative Feature Importance:
This provides an initial perspective on user preference at a feature level—prior to factoring in any variations. In this survey, we found that the property overview section had the most influence on user preference of the experience profiles.
![]()
Key Findings
︎
Relative Feature Importance:
This provides an initial perspective on user preference at a feature level—prior to factoring in any variations. In this survey, we found that the property overview section had the most influence on user preference of the experience profiles.
Relative Feature Importance:
This provides an initial perspective on user preference at a feature level—prior to factoring in any variations. In this survey, we found that the property overview section had the most influence on user preference of the experience profiles.
︎
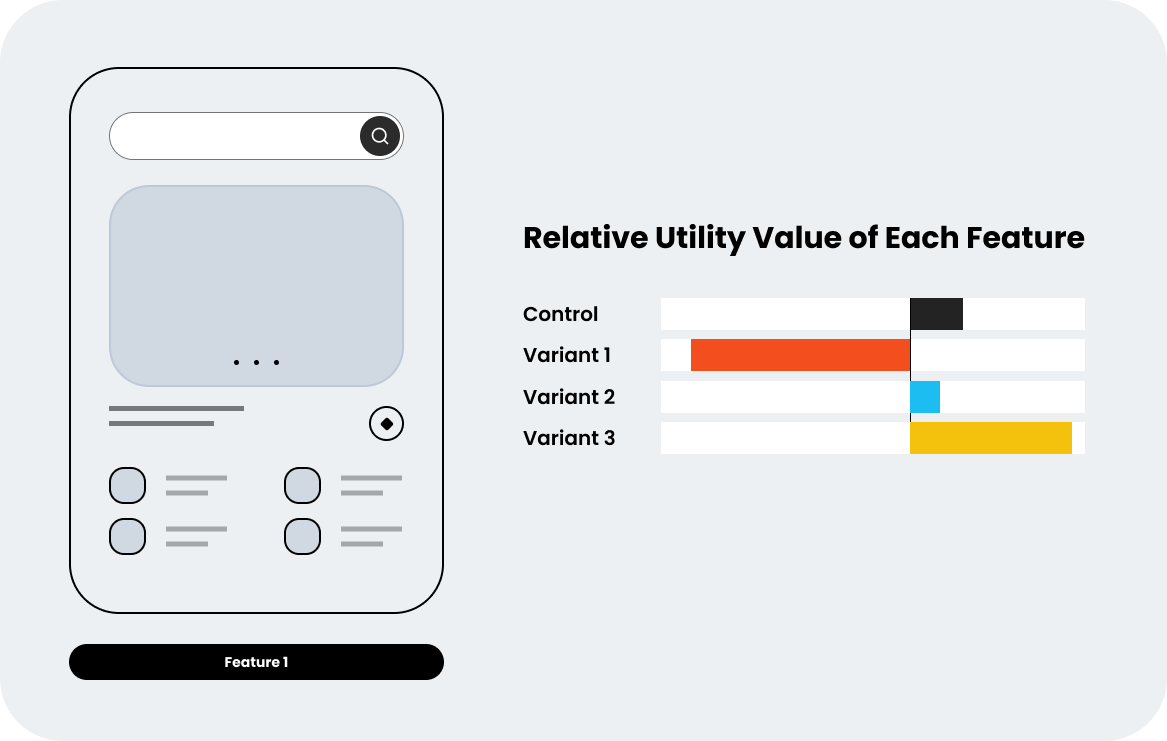
Relative Level Preference:
Delving into the features, we were able to identify the winning variations and strong contenders among the levels presented. Interestingly, certain control variations outperformed the new variations or performed at a comparable level.
![]()
︎
Relative Level Preference:
Delving into the features, we were able to identify the winning variations and strong contenders among the levels presented. Interestingly, certain control variations outperformed the new variations or performed at a comparable level.
Relative Level Preference:
Delving into the features, we were able to identify the winning variations and strong contenders among the levels presented. Interestingly, certain control variations outperformed the new variations or performed at a comparable level.
︎
Differences between Sub-Groups
The conjoint analysis also revealed some notable preference differences between specific user segments.
These insights into mobile and competitor site users provided an additional perspective for the team to consider when prioritizing projects.
![]()
︎
Differences between Sub-Groups
The conjoint analysis also revealed some notable preference differences between specific user segments. These insights into mobile and competitor site users provided an additional perspective for the team to consider when prioritizing projects.
Differences between Sub-Groups
The conjoint analysis also revealed some notable preference differences between specific user segments. These insights into mobile and competitor site users provided an additional perspective for the team to consider when prioritizing projects.

︎
Optimal Combinations
By quantifying the preference of different variations, we were also able to simulate different combinations of variations. This greatly helps with product planning as we can understand the level of impact depending on the amount of changes we want to make.
![]()
︎
Optimal Combinations
By quantifying the preference of different variations, we were also able to simulate different combinations of variations. This greatly helps with product planning as we can understand the level of impact depending on the amount of changes we want to make.
Optimal Combinations
By quantifying the preference of different variations, we were also able to simulate different combinations of variations. This greatly helps with product planning as we can understand the level of impact depending on the amount of changes we want to make.
Impacts
︎
Greatly Simplified Product Backlogs:
The conjoint study enabled the team to narrow efforts to 2 high-priority areas of the listing page requiring improvement. These 2 sections were identified as having the biggest potential impact on user preference based on the research insights.
︎
Translated to A/B Testings
The improvements for these priority areas were developed as controlled experiments on the live site. One of the first experiments implemented the winning variation from the conjoint study for the property overview section. This redesigned overview increased total engagement on that section of the listing page by 40% compared to the previous version.
Impacts
︎
Greatly Simplified Product Backlogs:
The conjoint study enabled the team to narrow efforts to 2 high-priority areas of the listing page requiring improvement. These 2 sections were identified as having the biggest potential impact on user preference based on the research insights.
Greatly Simplified Product Backlogs:
The conjoint study enabled the team to narrow efforts to 2 high-priority areas of the listing page requiring improvement. These 2 sections were identified as having the biggest potential impact on user preference based on the research insights.
︎
Translated to A/B Testings
The improvements for these priority areas were developed as controlled experiments on the live site. One of the first experiments implemented the winning variation from the conjoint study for the property overview section. This redesigned overview increased total engagement on that section of the listing page by 40% compared to the previous version.
Team
-
Stephanie Embry - Product Designer
- Nam Pham - Researcher
- Tonja Hardyman - Product Manager
Team
- Stephanie Embry - Product Designer
- Nam Pham - Researcher
- Tonja Hardyman - Product Manager